Study 2: Free-form Study
We conducted a second, free-form study, where participants were asked to craft any visualization using DataQuilt.


Recent years have seen an increasing interest in the authoring and crafting of personal visualizations.
Mainstream data analysis and authoring tools lack the flexibility for customization and personalization, whereas tools from the research community either require creativity and drawing skills, or are limited to simple vector graphics. We present DataQuilt, a novel system that enables visualization authors to iteratively design pictorial visualizations
as collages. Real images (e.g. paintings, photographs, sketches) act as both inspiration and as a resource of visual elements that can be mapped to data.
The creative pipeline involves the semi-guided extraction of relevant elements of an image (arbitrary regions, regular shapes, color palettes, textures)
aided by computer vision techniques; the binding of these graphical elements and their features to data in order to create meaningful visualizations; and
the iterative refinement of both features and visualizations through direct manipulation. We demonstrate the usability of DataQuilt in a controlled study and its expressiveness through a collection of authored visualizations from a second open-ended study.
Jiayi Eris Zhang, Nicole Sultanum, Anastasia Bezerianos, Fanny Chevalier. DataQuilt: Extracting Visual Elements from Images to Craft Pictorial Visualizations In Proceedings of ACM SIGCHI 2020, to appear.
We demonstrate the usability of DataQuilt in a controlled study and its expressiveness through a collection of authored visualizations from a second open-ended study.
We evaluated the fluidity of the workflow to create custom visualizations, i.e., how easy it is to go from extracting elements from images to binding these elements to data, and back.
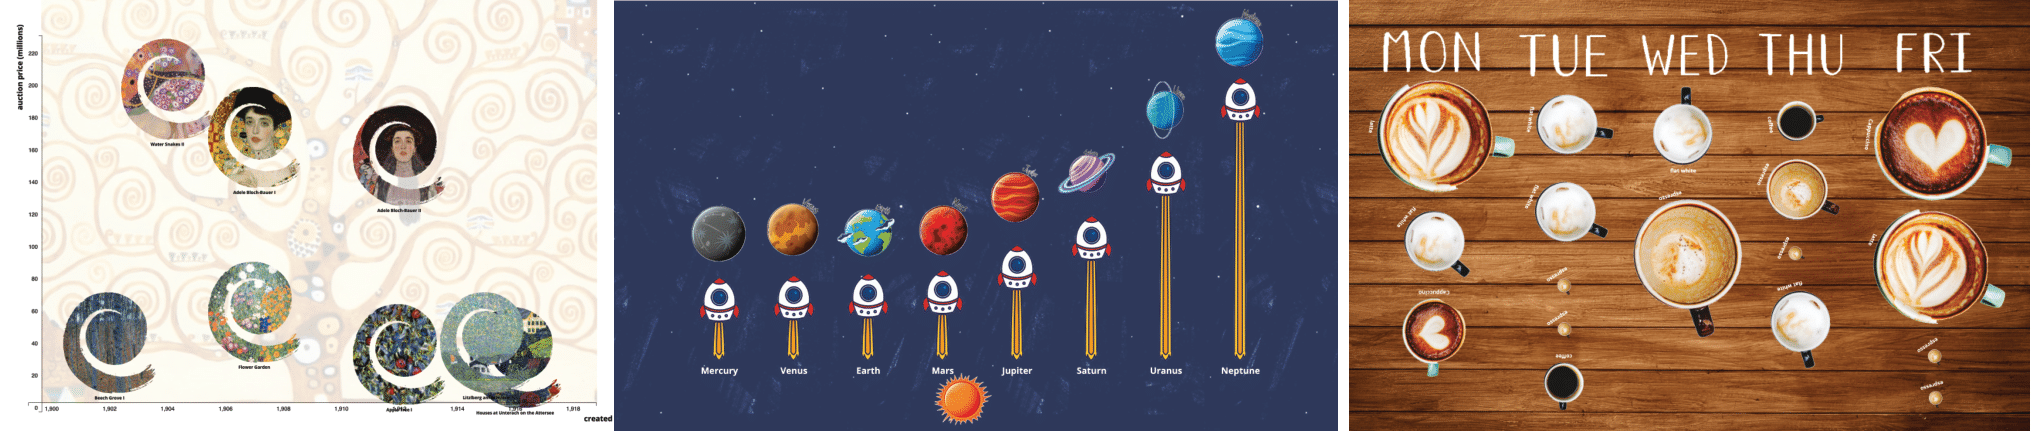
We conducted a second, free-form study, where participants were asked to craft any visualization using DataQuilt.
Here are some examples we generate from the tool.


